Pull up three different real estate sites this week and ask each one the same question, what's the median home price in Capistrano Beach, and you will get three answers that don't agree with each other by anything close to a rounding error. One site's tracker showed a median sale price of $1,691,786 for homes that closed in June 2026, down 6.3 percent from a year earlier. By late summer, that same platform's live market page was reporting an average sale price of $1.14 million, down 9 percent year over year, a different statistic measuring a different month but still pointing down. Movoto's read on August 2026 closings put the median sold price at $1,325,000. Orchard, looking at roughly the same trailing 30 days, reported a median of $2,450,000, up 45 percent year over year, while its own price-per-square-foot figure for the same window fell 10 percent.
Four data providers, one small stretch of coastline, and not one of them describing the same market.
If you've been watching Capo Beach listings and trying to figure out whether you're looking at a market that's up, down, or flat, the honest answer is that the question itself doesn't have a clean answer this year. Not because the data is wrong. Because Capistrano Beach is small enough, and architecturally varied enough, that a single month's closings can swing the reported median by six figures depending on which five or eight or twenty houses happened to sell.
Why the Same Neighborhood Can Report Three Different Medians
Every one of these numbers is technically accurate. Redfin, Movoto, and Orchard are each pulling from closed sales, just with slightly different date windows and slightly different property mixes. The problem is volume. Orchard's own count for its 30-day window was five homes sold, down from eight the year before. Movoto's August count was eight, flat year over year. Redfin's earlier snapshot for February 2026 showed 20 sales.
Twenty sales is already a thin sample for a neighborhood-level median. Five is not a market signal. It's whichever five houses happened to close escrow that month, and in Capo Beach those five houses could be almost nothing alike. A 1925 cottage a block off Palisades Road and a rebuilt oceanfront estate on Beach Road can both close in the same 30-day window and land in the same "median," even though they represent two entirely different products bought by two entirely different kinds of buyers. Swap one bluff teardown lot for one remodeled bungalow in the sample and the reported median can move by half a million dollars without a single home in the neighborhood actually changing in value.
This is why the same source can show the median falling 6.3 percent in June and the average falling 9 percent later in the summer, while a different provider shows the median rising 45 percent for roughly that same stretch. They're not disagreeing about the market. They're each reporting on a different, tiny handful of closings.
What's Actually Selling Here, and Why It Doesn't Compress Into One Number
Capistrano Beach earned its "Capo Beach" nickname honestly. Development on the bluff started back in 1925, and the neighborhood didn't become part of Dana Point until 1989, which is a long enough independent history to explain why the housing stock never settled into one architectural era the way a master-planned tract does.
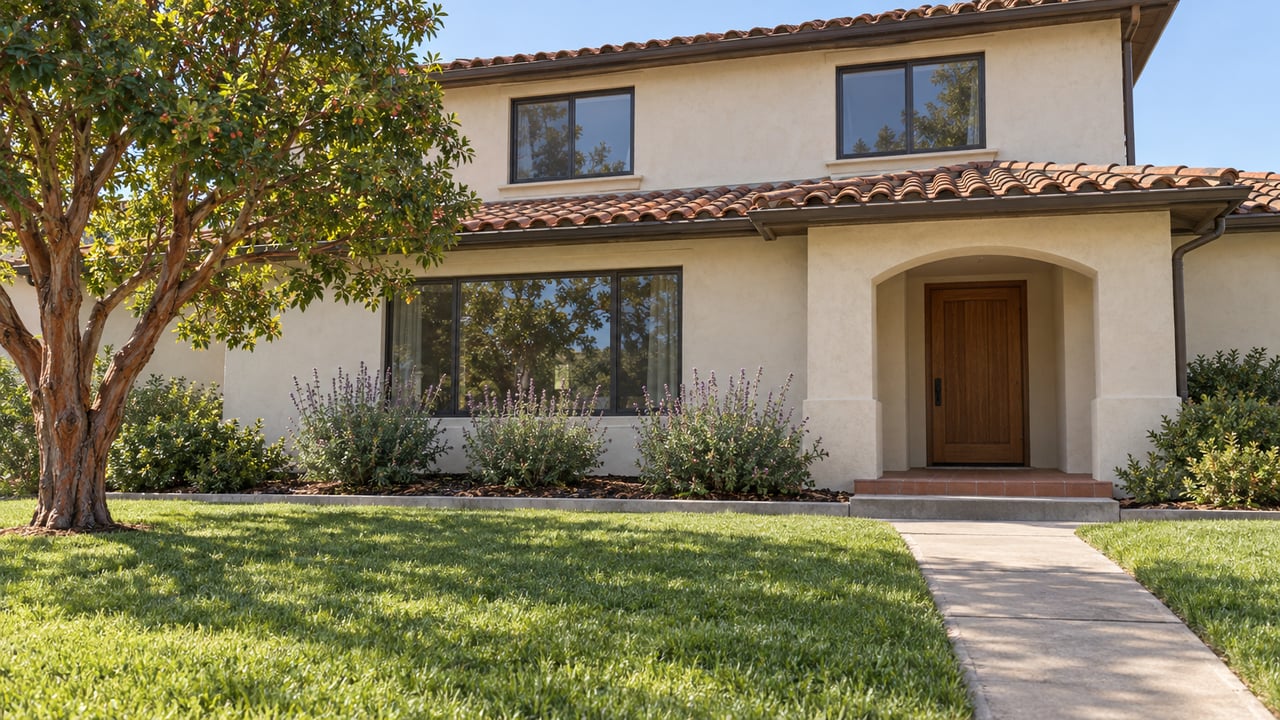
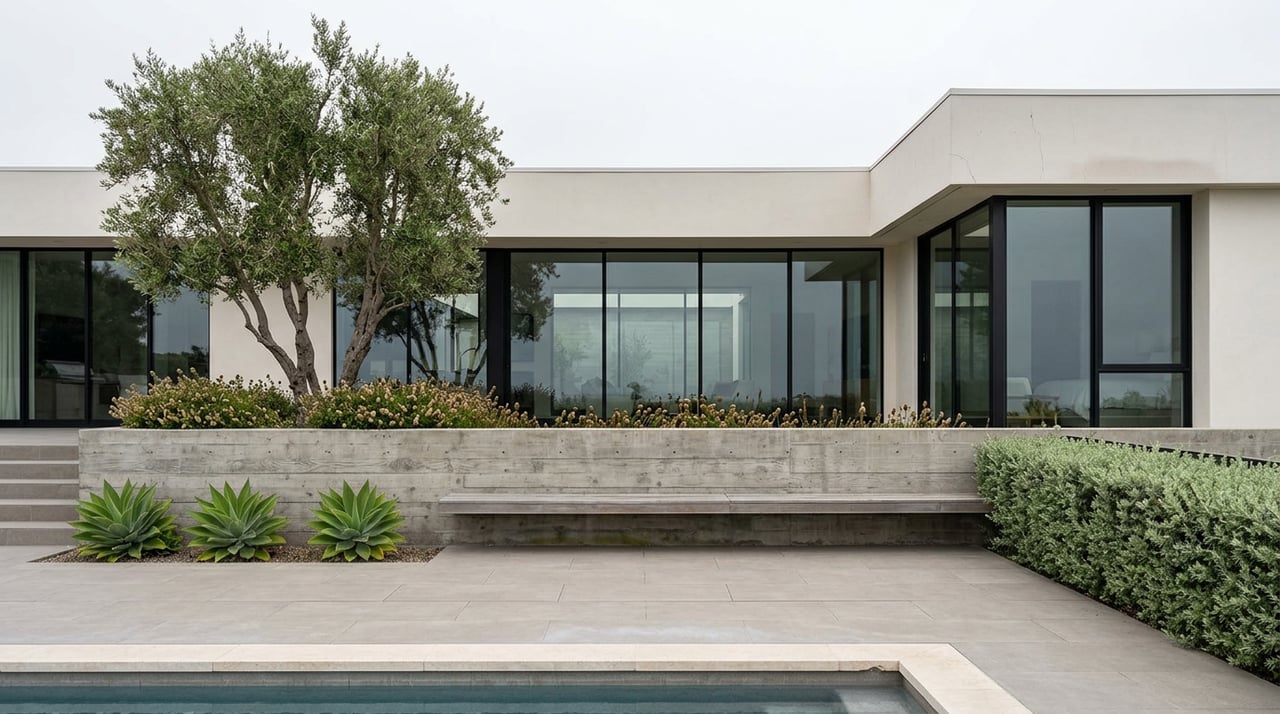
Walk the Palisades subdivision near Pines Park and you'll find 1920s cottages standing next to fully rebuilt two-story estates on the same block, sometimes on the same lot where an older home once stood. A few streets over sit mid-century homes from the 1960s, their low rooflines and open floor plans now drawing buyers specifically looking for that era's design language rather than a newer build. Then there's Beach Road, the guard-gated enclave where a limited number of homes sit directly on the sand, a genuinely different product from anything else in the neighborhood and priced accordingly.
Recent market reporting put entry-level Capo Beach homes starting near $863,000 and shoreline properties starting at $2.7 million and up. That's not a typo and it's not an unusually wide luxury tier. That's the normal spread within one neighborhood, on any given month, depending on whether that month's handful of sales happened to include a starter cottage inland or a rebuilt bluff-top estate.
A snapshot of active listings taken in early September 2026 showed 28 homes on the market in Capo Beach, averaging 96 days on market, with an average asking price of $1,471.69 per square foot and a median list price of $2,362,000. Every one of those asking figures sits meaningfully above any of the closed-sale medians from earlier in the summer, which tells you something the closed data alone can't: sellers are testing higher numbers than the market has recently paid, and the gap between what's listed and what's actually closing is wide enough to matter.
The Number That Deserves More Attention Than the Median
If the median is too noisy to trust in a neighborhood this size, what should you actually watch? Days on market and price per square foot, tracked within the same type of home, tell you more than a headline median ever will, though even these bounce around here. One provider showed Capo Beach homes taking 97 days to sell in February 2026, up from 53 the year before. By late summer, Orchard's window showed 81 days, up from 47 a year earlier. Movoto's August read showed 76 days, down from 133 the prior year. Even the direction of the trend depends on which window and which properties you're comparing.
What that inconsistency actually tells you is useful on its own. The absorption rate for a $900,000 cottage a half mile inland has nothing to do with the absorption rate for a $6 million rebuild on Beach Road, and averaging them together produces a number that describes neither. If you're pricing a home here, the comp that matters is the one built in the same decade, on a similar lot, in the same micro-pocket, not the citywide or neighborhood-wide median from whichever site you happened to open first.
What This Means If You're Actually Buying or Selling Here
For sellers, this is the argument for pricing off comparable product rather than a headline number. A 1960s single-level remodel and a new-construction two-story on an adjacent street are not the same comp, even if a listing site lumps them into the same neighborhood median. One Palisades listing currently on the market through Bullock Russell Real Estate Services, priced just under $2 million, illustrates the kind of mid-tier remodeled home that sits between the entry-level cottages and the oceanfront estates, and pricing it correctly means comparing it to homes of similar vintage and condition, not to whatever number a portal is currently displaying for "Capistrano Beach."
For buyers, the lesson cuts the other way. If a listing looks like a deal relative to "the median," check what kind of home that median was actually built from before you get excited. A number that looks 20 percent below market might simply reflect a month where more inland cottages closed than bluff-top rebuilds. The reverse is also true. A price that looks high against a stale median might be entirely fair for a rebuilt or Beach Road property that never belonged in the same bucket to begin with.
A Few Questions Worth Asking Before You Anchor to Any Number
Why don't the major sites agree on Capo Beach's median price? Because monthly sales volume here runs as low as five to twenty homes, and the neighborhood spans everything from 1920s cottages to guard-gated oceanfront estates. A handful of closings from one segment or the other can move the reported median by hundreds of thousands of dollars without reflecting an actual shift in value.
Does a rising price per square foot mean the neighborhood is heating up? Not on its own, and not reliably in a market this size. In the same window one provider showed Capo Beach's per-square-foot figure falling 10 percent year over year while a different provider showed the median sale price rising 45 percent. Both were technically true. Neither described the whole picture.
Is this kind of volatility unique to Capistrano Beach within Dana Point? Largely yes. Higher-volume Dana Point neighborhoods with more architecturally consistent housing stock tend to report tighter, more stable medians month to month simply because there are more transactions to smooth out the outliers. Capo Beach's combination of low volume and wide product variety makes it more sensitive to exactly which homes happen to close in any given month.
If you're trying to make sense of what a specific Capo Beach home is actually worth, or you're deciding whether now is the right window to list, the conversation is easier with someone who's tracking the comps street by street rather than reading one platform's monthly average. Maureen Muno Hensley works this stretch of coastline directly. Let's Connect.